Just to name a few that he’s accrued:
- Lou Henson Mid-Major All-American (2017-18)
- NABC All-District 10 Second Team (2017-18)
- All-CAA Second Team (2017-18)
- CAA All-Defensive Team (2017-18)
- CAA All-Rookie Team (2016-17)
- Two-time CAA Player of the Week
And with the national attention, opposing teams have had no choice but to pay more attention to Knight themselves. A smart strategy already employed by multiple opposing teams has been to try and get Nathan in foul trouble early. We don’t blame them — the more fouls Knight has, the worse he and W&M performs. But is that actually true?
That got us thinking: just how valuable is Nathan Knight to William & Mary’s success? To answer this question, we crunched some numbers. Several numbers, in fact, including Knight’s career game-by-game stats in: minutes played, fouls, and points — and ultimately, whether or not W&M won or lost those games. In essence, we wanted to see if Knight’s game-by-game foul totals affected his minutes played, average point totals, and the team’s winning percentage.
Our basic theories were as follows:
- Knight averages less minutes per game when he finishes a contest with more fouls.
- Knight averages less points per game when he finishes a contest with more fouls.
- The more fouls that Knight finishes a game with, the less of a chance W&M has to win.
But what we found might surprise you.
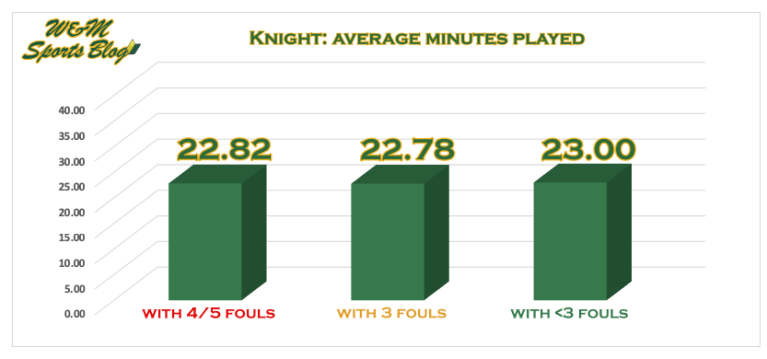
With each game of Knight’s career broken out (and then sorted by games in which he finished with 4/5 fouls, 3 fouls, or < 3 fouls), we were able to better understand how Knight’s final foul total impacted his playing time in games. Or in this instance, how it didn’t. At first, the fact that Knight has basically averaged the same amount of minutes per game, regardless of fouls, was surprising to us — and seemingly counterintuitive.
However, one quick explanation for this phenomenon is that Head Coach Tony Shaver does a good job at knowing when to put Nathan on the bench when he’s getting into foul trouble in the first place. For example, if Knight picks up two quick fouls in the first half, Shaver almost always elects to put him on the bench for the remainder of the first half — thus preserving him for the second half.
But what this first graph did was disprove our first theory: that Knight finishes with less minutes per game when he gets into foul trouble. Indeed, throughout his career, he has averaged almost the same exact minutes per game, regardless of his foul situation.
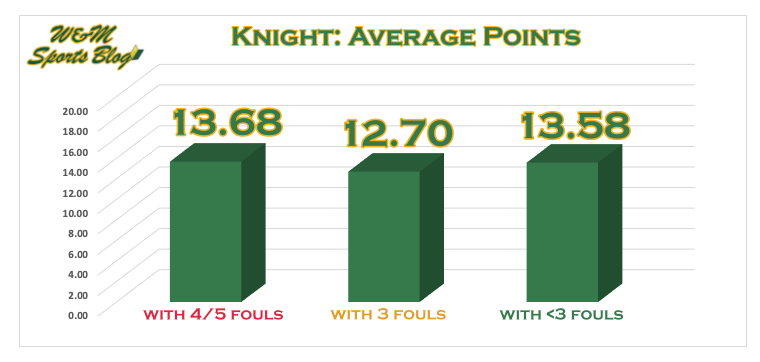
 Next, we set out to perform a similar analysis, but this time we analyzed how fouls did (or did not) affect Knight’s average points per game. Again, we were proven wrong. Statistically speaking, across his career, Knight not only finishes games with the same average minutes played per game irrespective of foul totals, but he also finishes averaging almost the exact same points per game irrespective of foul totals.
Keep in mind that these stats take into account Knight’s entire career (all the way up through this week’s ODU game); as he’s only a junior, and despite the fact that he’s currently started this year averaging 18 points per game through 9 contests (compared to 8 points per game his freshman year), these numbers will surely look different at the end of the season.
Even with that in mind, our second theory was disproven: that Knight finishes with less points per game when he gets into foul trouble. In fact, he finishes with almost the same exact amount of points per game, irrespective of his foul situation.
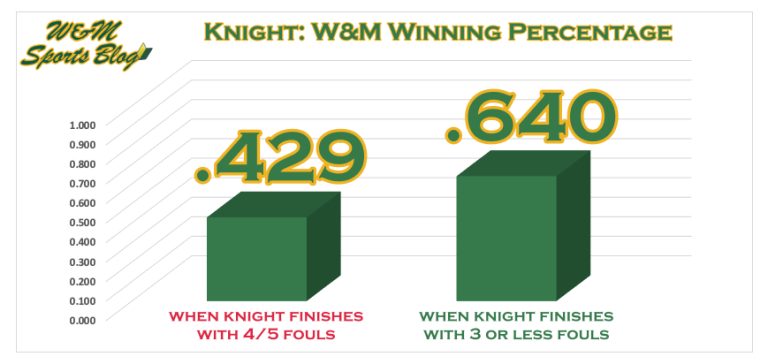
FINALLY. In our last calculation, we were able to discover a potentially significant insight. When Knight finishes a game with 4 or 5 fouls, W&M carries a .429 win percentage (12 wins 16 losses); when Knight finishes with 3 or less fouls, the team carries a .640 win percentage (32 wins 18 losses). That’s a 21% different in win percentage — which is a pretty big deal.
To be clear, Nathan Knight’s foul situation does not dictate whether or not his individual performance is hindered. In fact, the graphs above speak to the fact that Knight plays and contributes at a high level when he is on the court — and he typically contributes the same amount of minutes played and points per game irrespective of his foul situation (keeping in mind that these scoring totals continue to rise as he puts up strong numbers this season).
However, what this final graph does tell us is that when Knight finishes a game with 4 or 5 fouls, while he does not individually account for the entire 21% difference in W&M’s winning percentage in those contests, he likely accounts for a significant percentage of the difference. Simply put, when Knight gets into foul trouble, especially early in games, the team completely changes — for the worse, on the offensive and defensive ends of the court.
Instead of working the ball down low for the high percentage shot, or working the pick and roll plays — and instead of Knight drawing the double team down low to leave another man open — the team is forced to take lower percentage shots. On the defensive side of the court, we don’t need to tell you that Knight’s 6’10” height and 7’2″ wingspan helps in a significant way.
So how valuable is Knight to W&M basketball? In case you didn’t get this earlier: HE’S VERY VALUABLE.
LET’S GO TRIBE!!!
Update: If you’re interested in seeing how these numbers change when Knight’s freshman year data is excluded, check out the stats below. We’ll plan on updating this analysis toward the second half of the season, as the data piles in!
Minutes Played Per Game (Sophomore & Junior Year)
With 4/5 Fouls – 25.61
With 3 Fouls – 25.16
With Less than 3 Fouls – 30.27
Points Per Game (Sophomore & Junior Year)
With 4/5 Fouls – 16.11
With 3 Fouls – 14.63
With Less than 3 Fouls – 20.91
W&M Winning PCT
With 4/5 Fouls – 0.444
With 3 or less Fouls – 0.633


